Genomic Data Platform & Visualization Architecture
Rebuilt the frontend of a 3,000+ sample genomic database with mobile-first interactive visualizations that work in the field, not just at a desktop.
Industry
Bioscience & Data Visualization
Services Delivered
Marketing Website & Design System
Technologies Used
TypeScript, React, Three.js (WebGL), Node.js, GraphQL, PostgreSQL
The Challenge
Phylos Bioscience maps the genetic relationships of thousands of agricultural samples, giving cultivators the data they need for informed breeding and supply chain decisions. When we engaged, their platform had scaled past 3,000 samples but the interface had buckled under the load, with no mobile rendering for the scientists and cultivators who needed it in the field.
As Phylos Bioscience's genetic database scaled past 3,000 samples, their legacy frontend buckled under the load. Complex genomic relationships were trapped in confusing circular visualizations with no mobile rendering, making the platform unusable in the nurseries and greenhouses where their actual users operated. The science was sound; the interface made it inaccessible.
Diagnosis
An architectural review confirmed the frontend needed a complete decoupling from the legacy visualization layer. The strategy was not to refine the existing charts but to replace them entirely with mobile-first, interactive visualizations that could render complex genetic variations natively on any device without compromising scientific precision.
The Solution
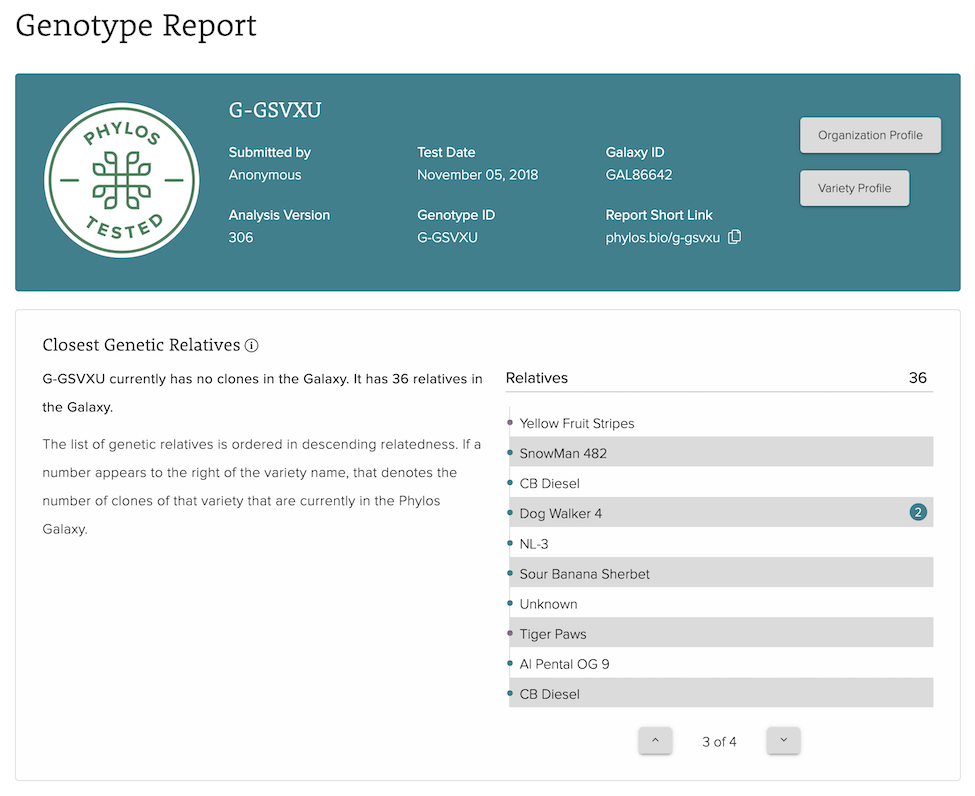
We engineered a bespoke, mobile-first genomic reporting platform built specifically to give cultivators field-level accessibility. We completely replaced the confusing circular layouts with highly responsive, scrollable lists that automatically map Closest Genetic Relatives and Clone Groups using descending algorithmic relatedness.
To handle the most complex data, we engineered interactive 3D charting to visualize Genetically Distant Varieties. We dynamically bound the color states of the interface directly to genetic subpopulation profiles, allowing users to visually parse the data immediately. Finally, we decoupled the heavy backend data sets into an optimized mobile architecture, ensuring cultivators could access fast, print-ready reports directly from their mobile devices.
The Outcome
- [1]
Genetic data readable in the field
Cultivators working in nurseries and greenhouses can now pull up interactive genetic reports on their phones. What required a desktop computer and confusing circular charts now works anywhere, on any device.
- [2]
3,000 samples with room to grow
The rebuilt architecture handles continuous database scaling without visual regressions or mobile lag. As Phylos adds samples, the platform grows with them rather than buckling under the weight.
- [3]
Phylos called it the industry benchmark
After launch, Phylos publicly cited the platform as the definitive standard for communicating complex scientific data in the bioscience space. That kind of recognition cannot be engineered directly, but it follows from the work.
Ready to Scale?
Discuss how Fieldset can engineer a deterministic path for your next phase of growth.